
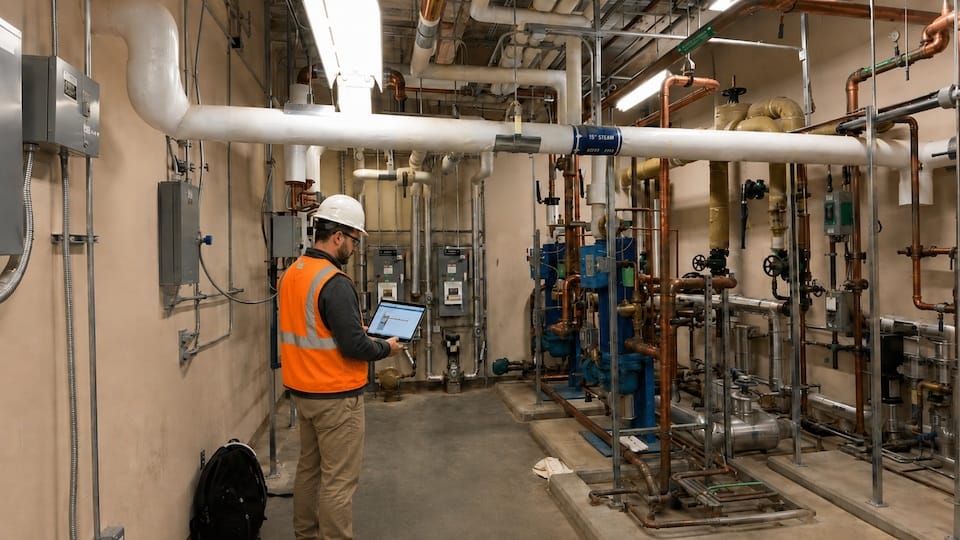
A hospital domestic hot water system passed its functional performance test with no anomalies observed. Within days, the system had developed issues. The evidence that explained exactly what went wrong was already sitting in the building’s BAS, logged and waiting. Nobody’s protocol required looking at it.
That gap, between what a functional test verifies and what a building system actually does over time, is what trending data is designed to close. This article explains what trending reveals, how to build a trend plan that actually catches failures, and where the method has limits.
What a Snapshot Test Can and Cannot Tell You
A snapshot test is a discrete, point-in-time observation within a functional performance test. A commissioning team commands a setpoint change, confirms the system responds correctly within the test script’s time window, records the result, and moves to the next test. For verifying control logic, sequence of operations, and immediate system response, that approach works well.
What it cannot reliably catch is behavior that unfolds over a longer time horizon. Gradual drift in a control loop, intermittent valve or damper failures that only surface under specific load conditions, performance issues that emerge only during transition states, and failures that take hours to develop can all pass a standard FPT without anyone in the room knowing anything is wrong.
Those are real failure modes, and they show up in systems that passed every test on the script.
A Hospital Water Heater That Passed, Then Failed

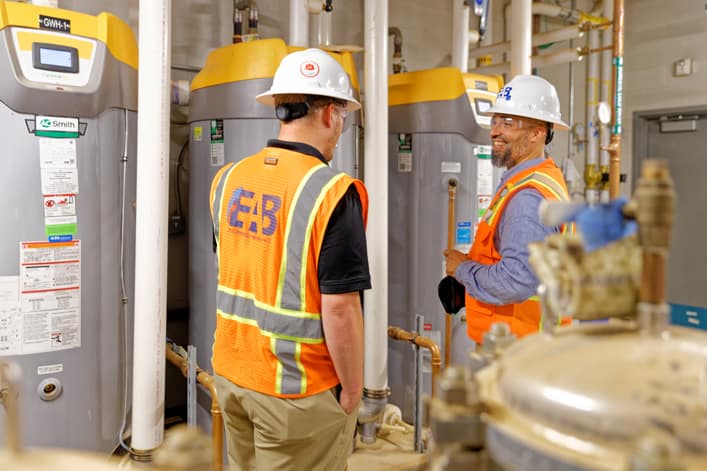
On a commissioning project at a Houston hospital, EAB was contracted to commission a replacement of domestic water heat exchangers serving an active facility. Two steam-to-water heat exchanger assemblies, domestic water heaters tagged DWH-1 and DWH-2, were installed in an N+1 configuration, meaning only one unit operated at any given time. Each generated hot water at 140 degrees F. That supply water was then tempered down to 120 degrees F by a new digital mixing valve assembly, tagged DMV-1, before serving the facility. For more on what makes domestic hot water commissioning complex, see EAB’s overview of domestic hot water systems and commissioning.
EAB reviewed the manufacturer’s startup documentation, which indicated control within plus or minus 2 degrees F of the setpoint. The functional test involved increasing and decreasing the supply water temperature setpoint and verifying that the system responded accordingly. No anomalies were observed during testing.
Within a few days of the completed FPT, EAB was contacted because the system had developed issues.
When trending data from the BAS was pulled and reviewed, the problem became visible. When DWH-1 was commanded to the off state with DWH-2 carrying the load, the discharge temperature of the offline unit fluctuated over a period of many hours before eventually settling. That fluctuation was completely invisible in the shorter time increments the FPT script used. Within those increments, DWH-1 had appeared stable.
The root cause was a steam control valve allowing intermittent flow through when commanded fully closed, an out-of-sequence operation of a system component that the standard test script had no mechanism to detect. It was confirmed by manually closing the steam isolation valve on DWH-1 and observing that the temperature fluctuation stopped.
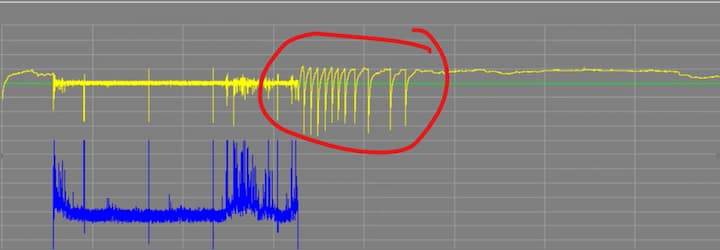
DWH-1 supply temperature (yellow) plotted against DWH-1 steam control valve command (blue).
The circled fluctuation unfolded over several hours and was invisible in the FPT script’s shorter test increments. The dips visible to the left reflect demand spikes during nightly cleaning operations, confirmed as expected load-response behavior.
The gap was not in the data. It was in the protocol. Trending review was not part of the standard FPT scope.
What Trending Data Reveals That Snapshot Testing Cannot
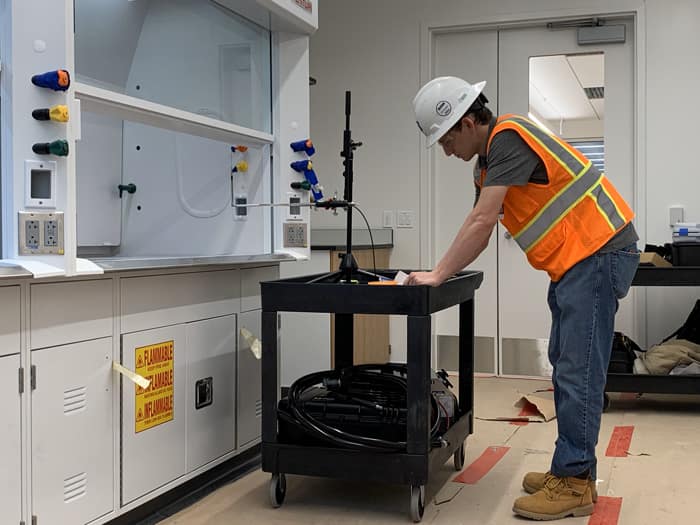
Incorporating trend review into functional performance testing provides visibility into system behavior that point-in-time verification cannot. Specifically, it allows the commissioning team to:
- Detect out-of-sequence component operation. The DWH-1 failure is a textbook example: a valve that appeared closed during testing was passing flow intermittently under real operating conditions. This is one of the failure categories the LEED monitoring-based commissioning framework explicitly names as a target for trend monitoring, and it is precisely what the snapshot test missed.
- Identify gradual drift and slow degradation. A control loop that holds the setpoint during a test can still be drifting slowly over days. Trending surfaces that drift before it becomes a system failure or an owner complaint.
- Catch intermittent instabilities. Some failures are cyclical or load-dependent. They may not occur during the test window but will appear in trend data as recurring patterns in temperature, pressure, or valve position.
- Verify control loop performance under real load conditions. The hospital project showed demand spikes during nightly cleaning operations that produced large, temporary drops in supply temperature. Trending allowed those drops to be evaluated in context and accepted by the engineer of record and facility staff as expected load-response behavior, not system faults.
- Flag suspected sensor bias. When a trended value diverges from a calibrated reference, a redundant sensor, or an expected physical relationship, that divergence is a signal worth investigating. The trend identifies the condition; field calibration confirms whether sensor drift is the cause. A single trend line cannot prove drift on its own.
A note on two benefits that are sometimes overstated: trending data from the commissioning period can support future troubleshooting and performance comparison, and where a facility already has analytics and maintenance workflows in place, that baseline may feed into predictive maintenance programs. Trending records can also support a facility water management program or project record where the parameters, retention, and acceptance criteria meet the applicable requirements. In both cases, the trend data is supporting evidence. What it supports depends on the jurisdiction, applicable code, accreditor, and facility policy.
Where Else This Applies
The domestic hot water (DHW) case is an illustration of the pattern, not a limit on where it applies. The same failure modes show up across building systems:
- AHU economizer changeover. Economizer sequences that perform correctly during the test can revert or partially fail under specific outdoor air conditions. Trending outdoor air damper position, mixed air temperature, and supply air temperature across a full occupied/unoccupied cycle reveals whether the sequence holds under real conditions.
- Chilled water plant lead/lag rotation. A chiller that stages correctly during testing may behave differently during a lead/lag switchover under peak load. Trending chilled water supply temperature, chiller status, and valve positions across a complete rotation catches issues that point-in-time testing cannot.
- VFD pressure-control loop stability. A variable frequency drive that appears stable during functional testing can hunt on a pressure-control loop under certain load conditions. Trending duct static pressure against VFD speed command over an extended period surfaces instabilities that look fine in a snapshot. EAB documented a cooling tower loop with this failure pattern, visible only in trend data, in a separate technical article on PID loop tuning during the commissioning process.
- Occupied/unoccupied changeover. Outside air damper operation, optimized start/stop timing, and space temperature recovery all behave differently under real occupancy schedules than under test conditions. Trending these points across at least one full cycle provides verification that the snapshot cannot.
How to Build a Trend Plan

Here is what a real trend plan actually specifies.
What to Trend
For the hospital DHW project, the trended points were: DWH-1 discharge water temperature (the controlled variable) and the DWH-1 steam control valve command (to correlate valve position with temperature behavior). Those two points, reviewed together, made the failure visible.
The general pattern for any system: trend the controlled variable, its setpoint, the command signal, the feedback signal, equipment status (on/off/lead/lag), and the source of any expected disturbance. For staged equipment, include the status of each stage. For valve-controlled systems, include both command and feedback so a discrepancy between the two is visible.
Not every point in the system needs to be trended. The selection should be driven by the suspected failure modes and the critical control relationships, not by what happens to be easiest to pull.
How to Set the Logging Interval
For the hospital DHW project, Dan Eckelkamp used 15-minute intervals. For that application, a 15-minute sample rate provided sufficient data points to observe the multi-hour temperature fluctuation without placing unnecessary load on the BAS network or IT storage.
The 15-minute interval worked here because the symptom being observed was a multi-hour temperature signature, not the valve’s own cycling rate. The interval has to resolve the behavior you can see, which is not always the same as the frequency of the underlying fault.
The general rule: sample fast enough to resolve the shortest behavior you actually care about. A 15-minute interval will smooth over a control valve hunting on a 90-second cycle. A 1-minute interval is appropriate for a system suspected of that kind of short-cycle instability. For binary points such as equipment status or damper open/closed, change-of-value logging is more useful than a fixed interval, since it captures every state transition rather than potentially missing one between samples.
Choose the interval before testing, based on the suspected failure mode. Choosing it after the fact often means the data resolution is wrong for what you are trying to see.
How Long to Trend
Tie the duration to the behavior, not to a fixed number of days. The minimum for any system is one full occupied/unoccupied cycle, since many failures only surface during the transition between modes. For staged equipment, trend through at least one complete lead/lag rotation. Where behavior is load-dependent, as it was in the DHW case, several days of trending may be required before the failure pattern appears.
The DWH-1 fluctuation took many hours to develop and many more to stabilize. A 4-hour trend window would not have caught it. The observation window has to be long enough for the behavior in question to actually occur.
What a Pass Looks Like, and Who Signs Off
Trending without defined acceptance criteria produces data with no clear decision point. Before trending begins, establish what a passing result looks like: the controlled variable stays within the design tolerance band, valve command and feedback agree within an acceptable margin, and no unscheduled state changes occur during a normal occupied cycle. Where the system has a manufacturer-specified control tolerance, that figure is the starting point.
When a trend result falls outside the acceptance band, it goes on the issue log with the same tracking and resolution process as any other FPT deficiency: root cause identified, corrective action documented, re-trend after correction, engineer of record sign-off before the issue is closed.
What Building Owners Should Expect, and What It Costs

The right questions to ask before the commissioning scope is finalized:
- Is trend review included in the FPT scope, or is it treated as a separate add-on?
- Which control loops and parameters will be trended, and at what interval and duration?
- How will trending data and acceptance criteria be documented in the commissioning report?
- Is post-handover trend review defined in the commissioning plan or ongoing commissioning scope, and if so, over what period and against what thresholds?
That last question is a scope question, not an FPT question. Post-occupancy trend review is separately scoped and should be confirmed in writing before the project closes out.
The University of Texas MD Anderson Cancer Center requires trend review as part of HVAC commissioning. As a result of the domestic hot water project described above, EAB now applies trend review beyond HVAC systems on applicable projects, because the same failure pattern can show up anywhere a control valve, damper, or staged piece of equipment is involved.
Trend review is not a separate field activity.
On most modern systems, the BAS is already logging the data, and the building automation optimization overview covers how BAS data feeds into the commissioning process. The cost driver is analysis time and the length of the observation window, not additional site visits. If the trend plan is defined early and the observation window runs parallel to other commissioning activity, the schedule impact is minimal. Where older systems lack the points, the history retention, or reliable timestamps needed for useful trending, the commissioning plan should specify temporary data logging or added instrumentation before FPT begins.
Where Trend Review Fits in the Process
The monitoring-based commissioning framework already defines what a trend plan contains: points, frequency and duration, acceptable limits, and a corrective action path. But that framework is scoped to post-occupancy performance monitoring, and on most projects it only appears when a team is pursuing an optional certification credit.
The DWH-1 failure showed up days after a passing functional test. The framework was right; the timing was wrong. Trend review applied during functional performance testing, not just after handover, is what catches the failure modes that develop between the test and occupancy.
What Trend Data Cannot Tell You
Trending is not a complete picture on its own. A few limits worth naming:
- Point mapping errors produce data that looks plausible but measures the wrong thing. Verify the point list against the as-built sequence before trusting the trend output.
- Clock and timezone desync between the BAS and any external logger can make simultaneous events appear offset. Confirm timestamps before correlating points across systems.
- Gaps and missing samples in the trend record may hide the exact moment a failure occurred. Review for completeness before drawing conclusions.
- Uncalibrated source sensors produce trended values that are internally consistent but wrong in absolute terms. Trending flags divergence; calibration confirms whether the sensor is the problem.
Simple, stable, non-critical components with well-understood behavior and short response times do not always need the same trend depth as the complex control systems described above. The trend plan should reflect the actual risk profile of each system, not apply uniform intensity across everything in the building.
Frequently Asked Questions
What should you trend during a functional performance test?
Trend the controlled variable, its setpoint, the command signal, the feedback signal, equipment status, and the source of any expected disturbance. For valve-controlled systems, include both command and feedback so a discrepancy between the two is visible. For staged equipment, include the status of each stage. Selection should be driven by suspected failure modes and critical control relationships, not by what is easiest to pull from the BAS.
How long should you trend a system during commissioning?
Tie the duration to the behavior you are trying to observe, not a fixed number of days. The minimum is one full occupied/unoccupied cycle. For staged equipment, trend through at least one complete lead/lag rotation. For load-dependent behavior, several days may be required before the failure pattern appears. The observation window has to be long enough for the behavior in question to actually occur.
Does trend review delay project handover?
Not if it is planned early. The BAS is already collecting data on most modern systems. The cost driver is analysis time, not additional site visits. When the trend plan is defined at the start of FPT, and the observation window runs parallel to other commissioning activities, the schedule impact is minimal.
What does a passing trend result look like?
The controlled variable stays within the design tolerance band, the valve command and feedback agree within an acceptable margin, and no unscheduled state changes occur during a normal occupied cycle. Where the system has a manufacturer-specified control tolerance, that figure is the starting point. Results outside the acceptance band go on the issue log with the same tracking and resolution process as any other FPT deficiency.
The Lesson From One Houston Hospital

The DWH-1 steam valve failure was detectable. The evidence was already in the building’s own BAS data. The protocol just did not include reviewing it before the project closed out.
That is the argument for making trend review standard, not as an upgrade for complex projects, but as the baseline expectation for any system where a failure that develops over hours would not be visible in a standard test script. For more on commissioning in healthcare settings, see EAB’s overview of healthcare commissioning.
Technical source: Dan Eckelkamp, CxA, Commissioning Project Manager, EAB.
Work With a Commissioning Team That Goes Beyond the Checklist

EAB’s commissioning teams incorporate trending data review into functional performance testing because a passing result during a snapshot test is not the same as a verified, stable system. If your project involves complex mechanical systems where performance matters after handover, visit how EAB approaches the commissioning process.